Assessment
Download it and send it back by email.
Download brochure
Check out our brochure online
Dr. Michael West
Department of Materials and Metallurgical Engineering
501 E Saint Joseph St,
Rapid City, SD 57701
Tel: (605) 394-1283
Fax: (605) 394-3369
michael.west@sdsmt.edu
Assessment Summary (Updated 2017)
REU: Back to the Future
The Back to the Future Site provides opportunities for a diverse group of students. A primary focus of the REU program is to develop the research capacity of young men and women by providing an opportunity for students to fully engage both intellectually and developmentally in a body of research by working closely with researchers in the field. For students involved with the REU Site successful programming should reflect greater persistence both at the undergraduate level and at the graduate level. Students fully engaged in the research experience would have a stronger belief in their ability to conduct meaningful and independent research. In addition to greater self-efficacy, students engaged in the program should exhibit greater confidence in the professional development component. Specifically, an ability to engage professionally in a body research would be reflected in both oral and verbal communication skills. Assessment components include the following:
- Establishment of a cohort group and tracking sheet for longitudinal tracking of REU participants
- Completion of the Herrmann Brain Dominance Inventory
- Completion of the Undergraduate Research Student Self-Assessment (URSSA)
- Assessment of student communication skills including a pre and post assessment
- Focus group interviews with student participants during the final weeks of the REU program.
A brief description of assessment results follows. It should be noted that some assessment activities from 2017 are in progress.
Demographics
The Back to the Future REU program has supported a diverse group of students from 25 different states plus Puerto Rico. Figure 1 shows the home university program of the 91 students who have been served by the program thus far.
|
|
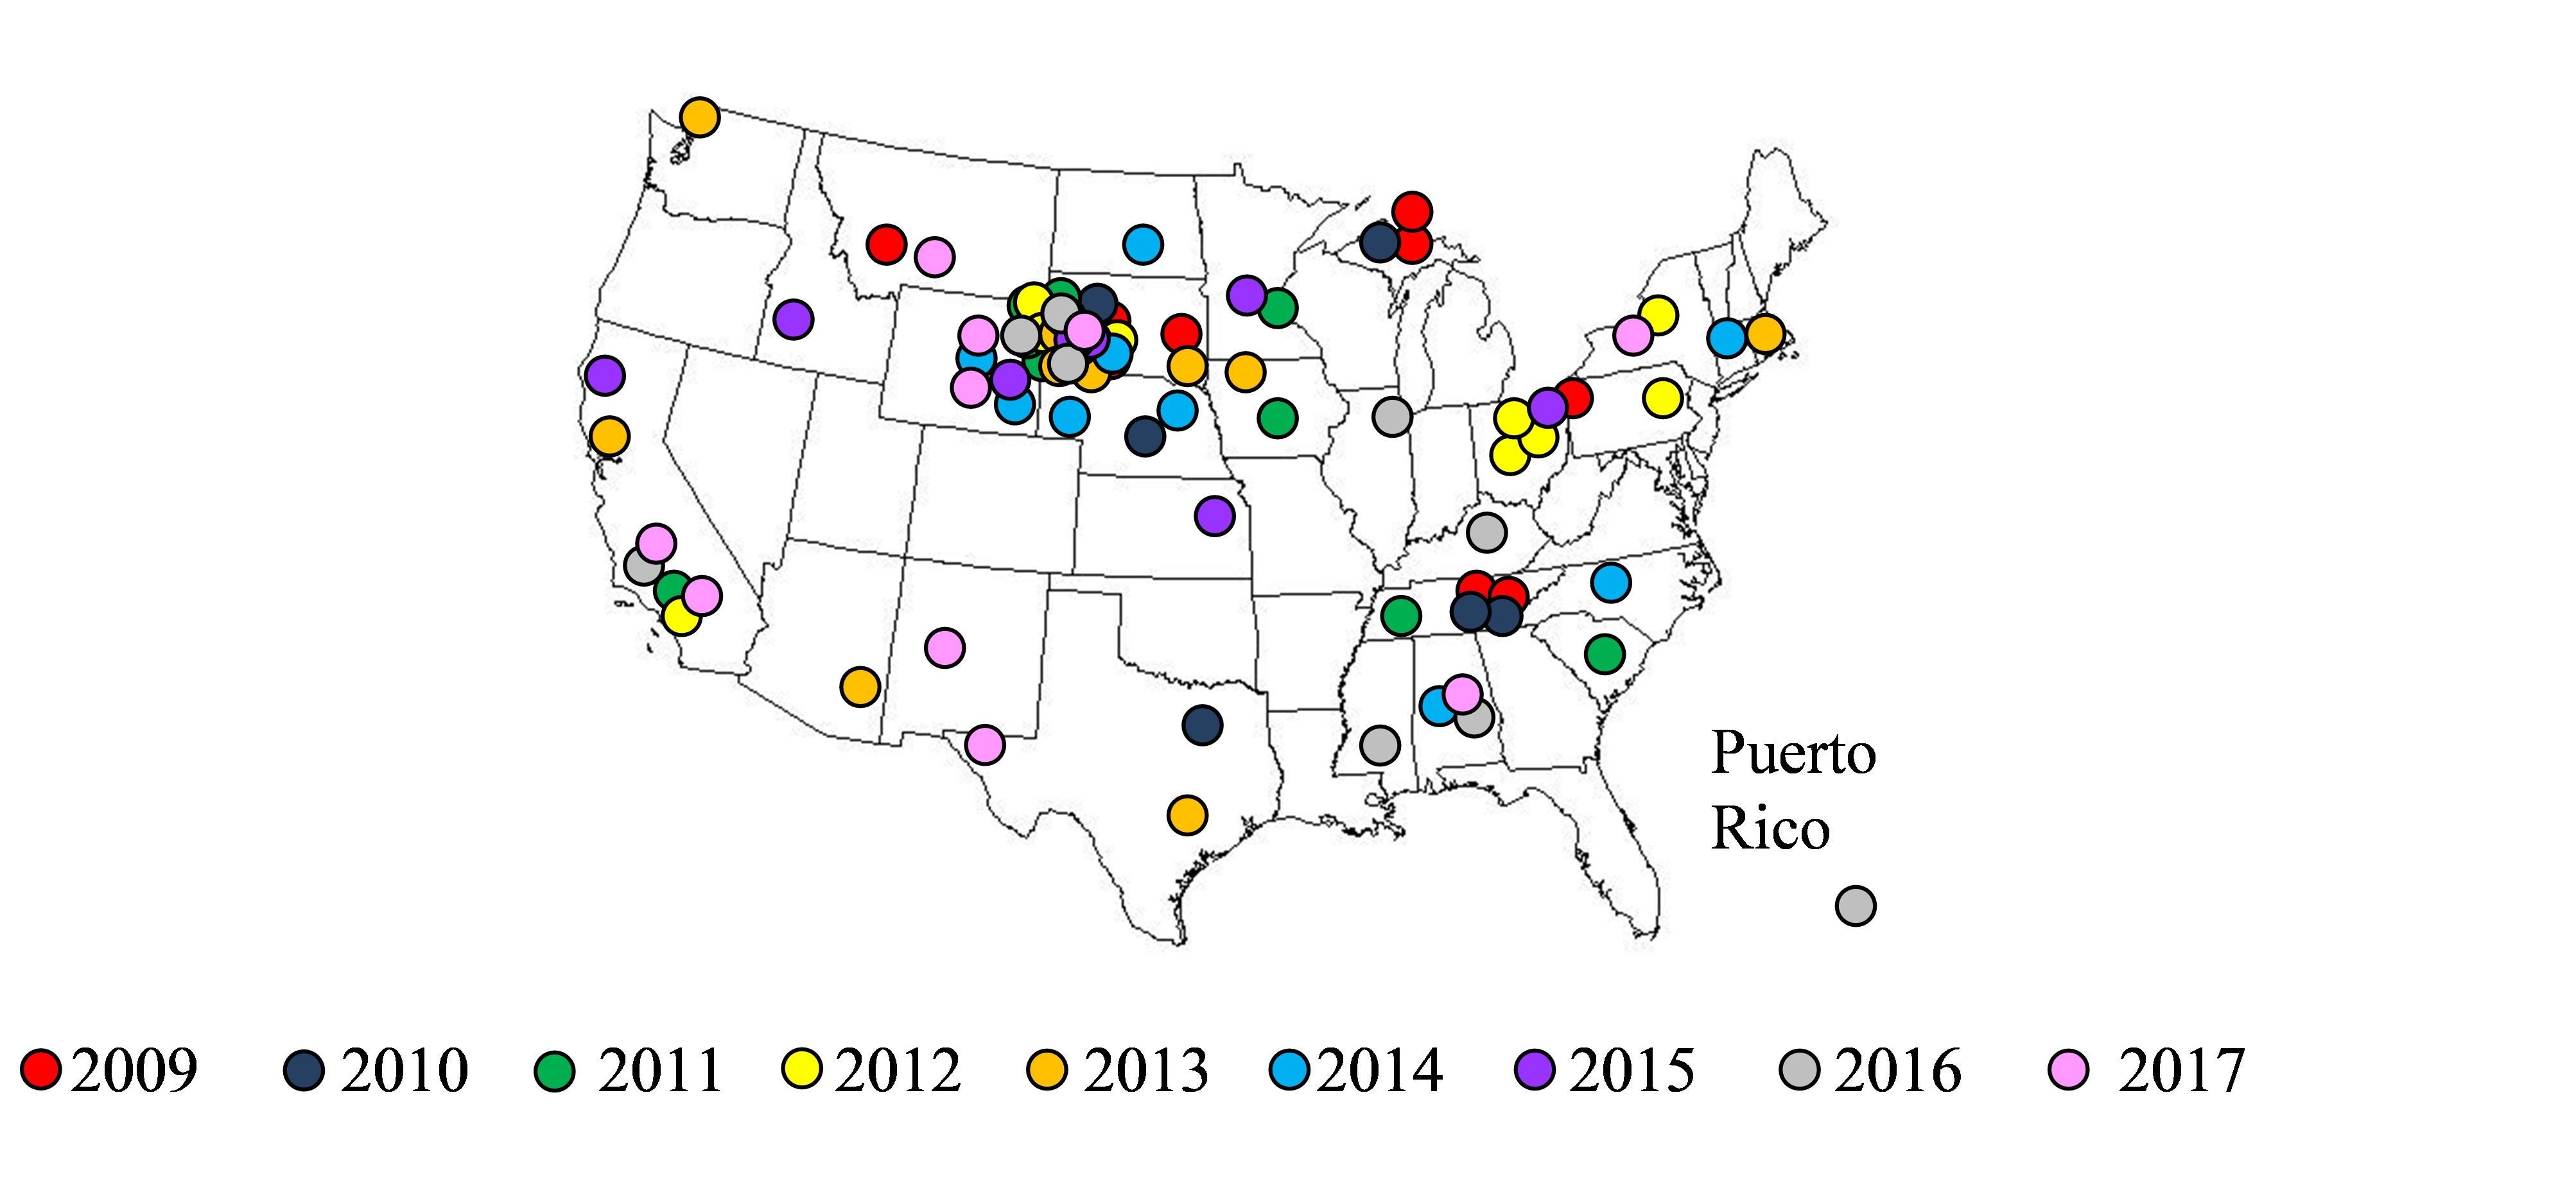
Figure 1. Geographic Location of REU Students 2009-2017
Overall Program Student Information Summary 2009-2017
Academic Majors2009 = 2 MET, 1 ME, 4 MSE, 1 Physics, 1 CSC 1 Education 2010 = 4 MET, 3 ME, 2 MSE, 1 Physics, 1 MINE, 1 IE, 1 Civil 2011 = 3 MET, 3 ME, 1 EE, 1 IE, 1 EE, 1 ENG, 1 Math, 1 Philosophy 2012 = 2 ENG, 1 MET, 1 ME, 1 CHEME, 1 IE, 1 BME, 1 EE, 1 Biochemistry, 1 CSC, 1 Physics, 1 Chemistry 2013 = 2 MET, 2 ME, 2 Civil, 2 ENG, 1 BME, 1 Physics, 1 CHEME, 1 Math 2014 = 3 MET, 2 Pre-ENG/Technology, 1 ME, 1 BME, 1 Biology, 1 Geology, 1 Chemistry, 1 Physics 2015 = 4 ME, 2 MET, 2 CHEME, 1 Chemistry, 1 Biochemistry, 1 Physics 2016 = 2 Chemistry, 1 MSE, 1 MET, 1 ENG, 1 ME, 1 Physics, 1 Polymer Sci, 1 Civil, 1 Biochemistry 2017 = 3 MET, 2 Pre-ENG/Technology, 1 MSE, 1 Physics, 1 Chemistry, 1 Biochemistry, 1 Biomedical Science
Totals| Metallurgical Engineering (MET) = 22 Mechanical Engineering (ME) = 16 Materials Science Engineering (MSE) = 9 Physics = 9 General Engineering (ENG) = 6 Chemistry = 6 Chemical Engineering (CHEME) = 4 Civil Engineering (Civil) = 4 Pre-ENG/Technology = 4 Biochemistry = 4 Industrial Engineering (IE) = 3 | Biomedical Engineering (BME) = 3 Electrical Engineering (EE) = 2 Computer Science (CSC) = 2 Math = 2 Polymer Science = 1 Biomedical Science = 1 Mining Engineering (MINE) = 1 Geology = 1 Biology = 1 Philosophy = 1 Education = 1 |
| Total = 22 different academic majors |
| 2009 | 2010 | 2011 | 2012 | 2013 | 2014 | 2015 | 2016 | 2017 | |
| Freshman | 1 | 2 | 2 | 0 | 1 | 0 | 2 | 1 | 1 |
| Sophomore | 4 | 6 | 7 | 4 | 6 | 8 | 4 | 3 | 5 |
| Junior | 4 | 3 | 2 | 7 | 5 | 3 | 5 | 5 | 3 |
| Senior | 1 | 1 | 1 | 2 | 0 | 0 | 1 | 1 | 1 |
*Includes 2 participants in 2010, 2011, 2012, 2013 and 1 participant in 2014 and 2015 from NSF I/UCRC CFSP Supplemental REU, and 1 participant 2015 funded from Office of Naval Research Total participants = 100
Academic InstitutionsBlack Hills State University, Boise State, Cal Poly Pomona, Cal State San Bernardino, Casper College, Citrus College, College of Saint Benedict, Dordt, Eastern Arizona College, Eastern Wyoming Community College, Grinnell College, Grove City College, Hastings College, Humboldt State, Inter American University of Puerto Rico, Irvine Valley College, Loyola University Chicago, Michigan Technological University, Montana State University, Montana Tech, New Mexico Tech, Northeast Nebraska Community College, Oberlin College, Oglala Lakota College, Ohio Wesleyan, Scripps College, Smith College, South Dakota School of Mines and Technology, South Dakota State University, Southern Mississippi, SUNY-ESF, Texas A&M University, Union University, University of Alabama, University of California Davis, University of Dallas, University of Dayton, University of Kansas, University of Mary, University of Nebraska Lincoln, University of Rochester, University of South Carolina, University of St. Thomas, University of Tennessee Knoxville, University Texas El Paso, Wake Forest University, Western Nebraska Community College, Western Washington, Wilkes University, Wooster Polytechnic, Youngstown State
(46 different institutions, Primarily Undergraduate Institutions and Colleges with Limited Research Opportunities shown in BOLD)
Student DiversityThe program directly supported 61 men and 39 women as well as 17 Native American, 7 Hispanic students, 2 Asian American, 2 African American, and 3 Veterans
Number of women supported by the program = 39% 2009=3 2010=4 2011=6 2012=5 2013=4 2014=5 2015=4 2016=4 2017=4
Number of minorities supported by the program = 27% 2009=2 2010=5 2011=2 2012=2 2013=4 2014=3 2015=3 2016=3 2017=3
Matriculation data (as of 2017): Total Students = 101 Students graduated in STEM or still enrolled full-time in STEM programs = 97 (96%) Students graduated in STEM = 75 Graduated students attending grad school/post secondary = 40 (53%) Graduated students working full-time in STEM fields = 31 (47%) teaching (4%) Students still enrolled full-time in STEM programs = 22
Herrmann Brain Dominance InventoryAll students participating in the REU program were given the opportunity to complete the Herrmann Brain Dominance Inventory (HBDI). Interest in this instrument is two-fold. First, does the REU program attract students with a stronger analytical thought process or does it attract an intellectually diverse group of students. The latter may be an important consideration for some areas, particularly if there is a strong interest in under-represented populations. A second interest in this instrument is to determine if the level of satisfaction with the REU experience is dependent on the thinking preference typology. Focus group interviews for the summer 2009 through 2014 did not indicate any degree of correlation between a student’s typological profile and level of satisfaction. Results from the HBDI for 2016 and for participants through the entirety of the program are shown in Figure 2 below.
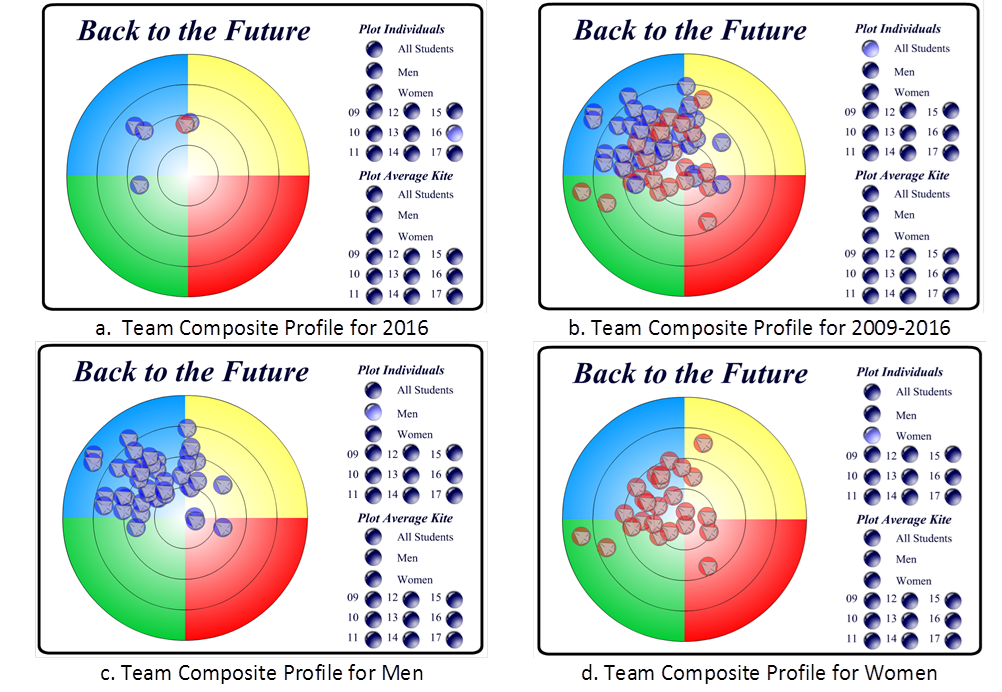 Figure 2. HBDI Results form REU Participans (Summer 2009 - Summer 2016)
Figure 2(a) shows the combined team composite for REU participants for 2016 only. Figure 2(b) shows the team composite for the seven years the program has been offered (2009-2016). The blue circles denote typological preference for the men and the red circles denote the typological preference for the women. Figure 2 shows that, on average, REU participants have a stronger leaning towards an analytical (blue) thought process. However, it is also clear that the program tends to attract a fairly intellectually diverse group of student researchers. This is commendable since this is atypical of engineering education in general. The composite typological profile for men is shown in Figure 2(c) and the profile for women in Figure 2(d). This shows that male participants tend to be more comfortable with analytic thought processes whereas women tend to enjoy engineering and design more if it has an societal impact. A common perception is that students exhibiting a right brain profile are less likely to pursue engineering or science and there is some campus data to support this perception at the undergraduate level. While women participating in the REU tend to be more analytic than the general population, it is also true that their typological profile is shifted downward and to the right. We would like to conduct a final survey of current and past participants next summer to determine if typology does make a difference.
From 2009-2016, we saw no significant typological differences between American Indian researchers and the general body. We did, however, see significant typological differences between male and female researchers. The data shown in Figures 2 is a flash file with an attached database. The database is updated with each subsequent REU program. Consequently, all plots composites and average kites can be explored on the fly. Currently this file is maintained at http://skellogg.sdsmt.edu/HBDIREU.htm.
Undergraduate Research Student Self-AssessmentThe Undergraduate Research Student Self-Assessment is an NSF sponsored inventory specifically designed to address a number of issues of interest to undergraduate research. The site is maintained at the SALG site ( http://www.salgsite.org ). A total of 7 students completed the URSSA SALG inventory in 2016.
Question 1 related to average gains in thinking and working like a scientist. Specific questions and average response scores (l=no gains, 5 = great gain) follow. Figure 3 below shows perceived gains in 2013 in thinking and working like a scientist as a result of the REU experience.
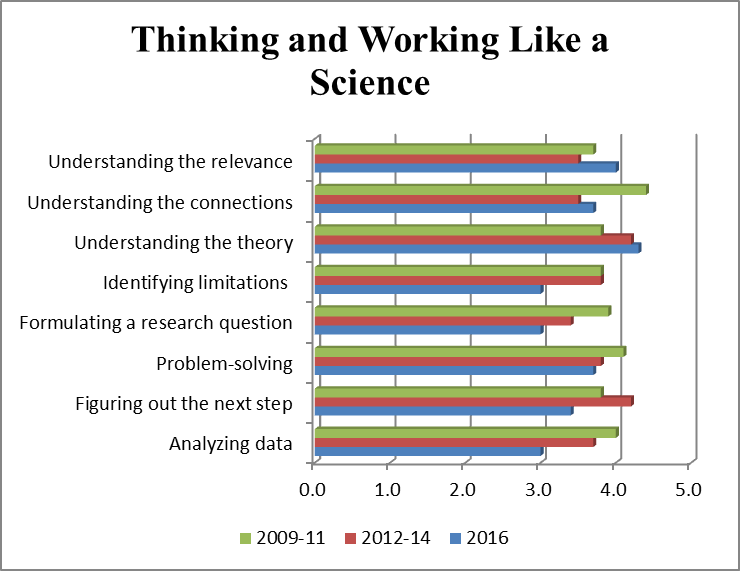 Figure 3 Perceived Gains for 2009-11, 2012-14, and 2016 for Question 1 Sub-items
Question 2 responses relate to personal gains related to the research work. Figure 4 below compares the average response for each item in question 2.
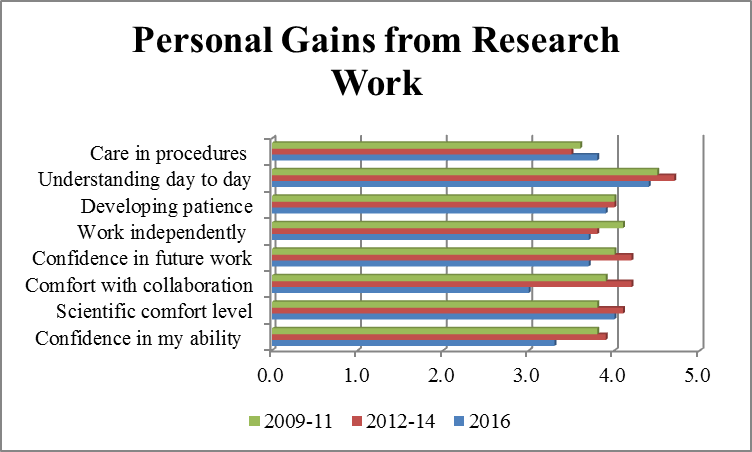 Figure 4 Personal Gains Related to Research Work
Question 3 relates to perceived gains in personal skills related to scientific research. Figure 5 below shows perceived gains in scientific skills for 2009-2011, 2012-2014, and 2016.
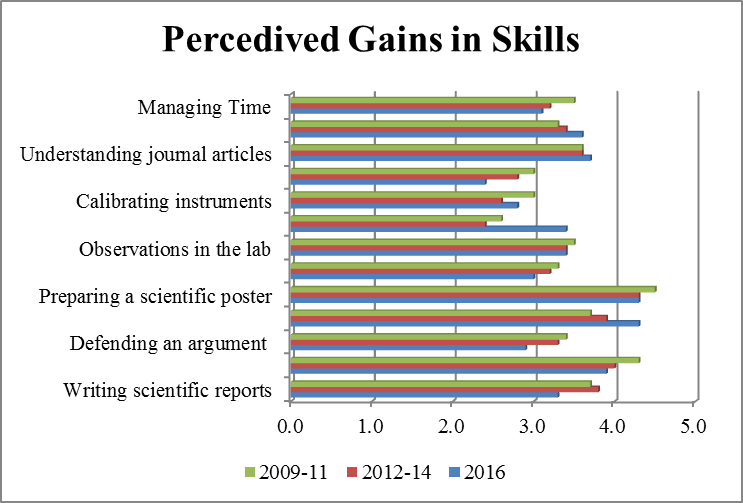 Figure 5 Average Gains for 2009-1, 2012-14, and 2016 for Question 3 Sub-items
Question 5 of the SALG survey relates to changes in attitudes or behaviors as a result of participation in the REU experience. Figure 6 below shows a weighted average of changes in attitudes for all participants in the 8 year REU program.
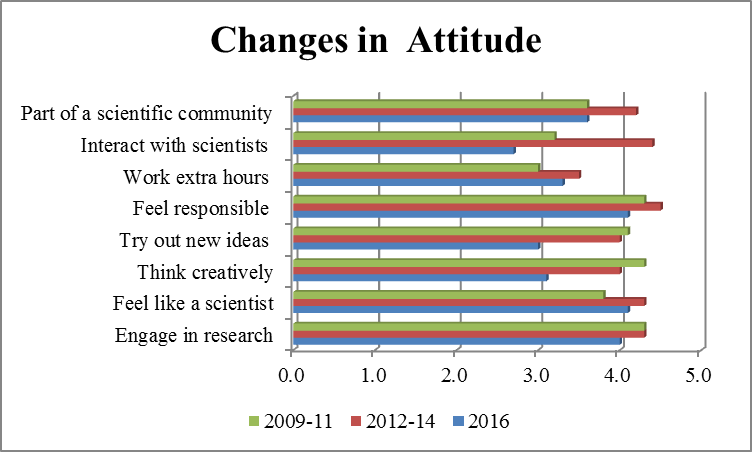 Figure 6 Perceived Gains for Question 4 Sub-items
Figure 7 below provides a summary response for REU participants for overall research experience for 2009-2015 (1=N/A, 2=poor, 5=excellent).
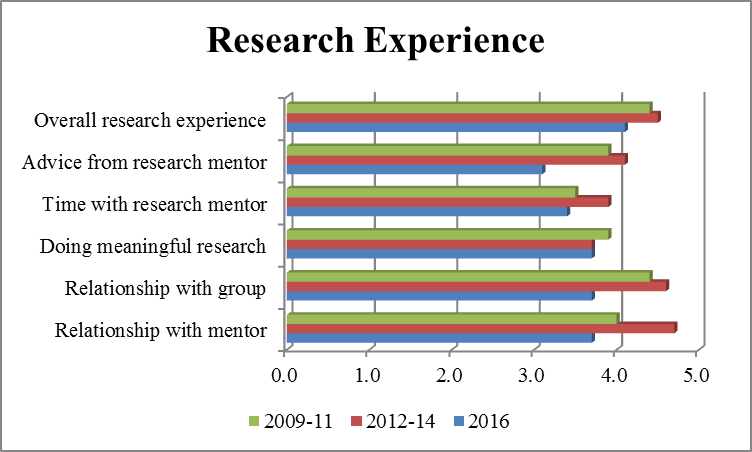 Figure 7 Average Response for Items Related to the Overal Research Experience
The two remaining questions tabulated from the URSSA are questions 7 and 8 related to the overall research experience. Average response scores are shown in Figures 8 and 9 below.
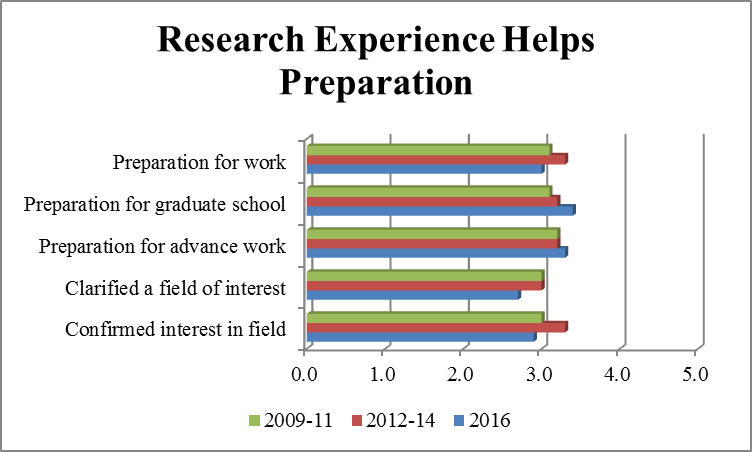 Figure 8 Average Gains for Question 7 Sub-items
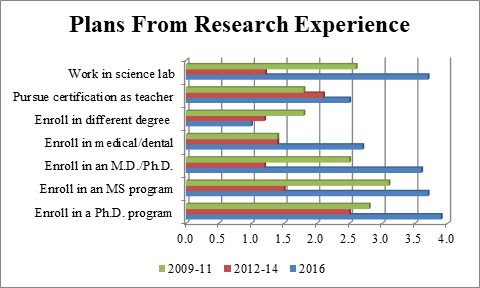 Figure 9 Average Gains for Question 8 Sub-items
A focus group is conducted near the end of each REU session. Over the past year as well as the previous years of the Back to the Future REU program, research participants have been generally positive about the program. For most participants, positive aspects of the program include their relationship with the faculty mentor, the social connections built into the program, the professional development activities (particularly the graduate school seminar). Students stressed the value of being co-located in the dormitory with other students and found the collaborative aspects of several REU’s and the social connections to be very beneficial.
One of the queries made during the focus session includes their thoughts about research and pursuit of the graduate program. As in most years opinions vary slightly and in particular, in past REUs to be more disjointed on the overall impact the REU has had on overall attitudes towards graduate school. Students in the Back to the Future REU in 2016, however, seemed to be more positive towards the aspects of graduate school and eventual enrollment in a Ph.D. program than they had in recent years. Comments were consistent with overall attitudes about research (Figure 9).